Grafana allows you to browse operating system-level logs recorded in files.
To browse log files with Grafana
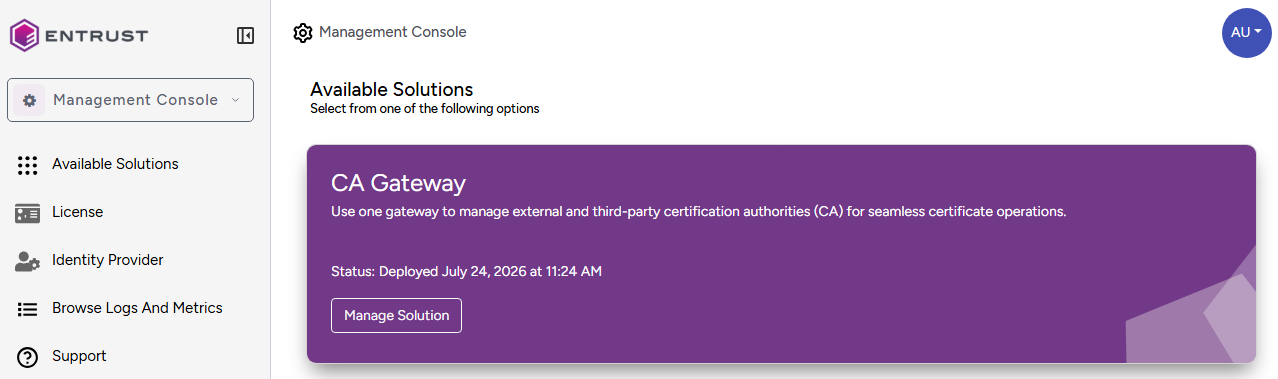
- Log in to the Management Console.
- Click the Browse Logs and Metrics sidebar command.
- Log in with the username and password set when Updating the Grafana initial administrator.
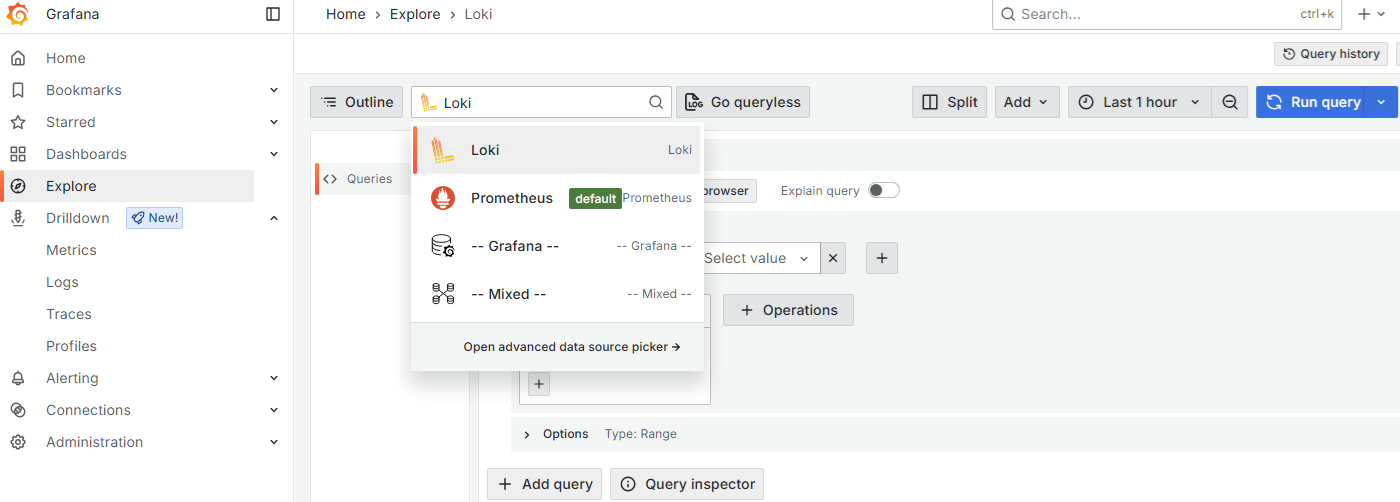
- Click Explore in the sidebar and Loki in the top list.
- In the Label filters list, select filename.
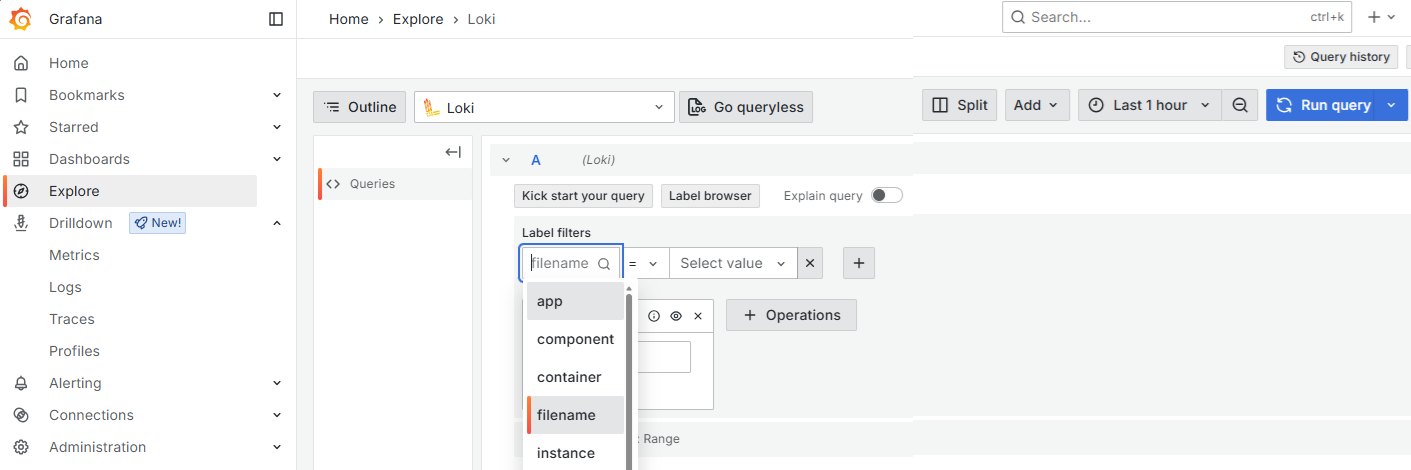
- In the Select value field, select a log file.
- Click +Operations to filter the file contents.
- Click +Add query to include additional filters.
- In the top-right corner, click Run query to display the selected contents.