Click the Insights button at the top to display a statistics dashboard that slides down above the configurations.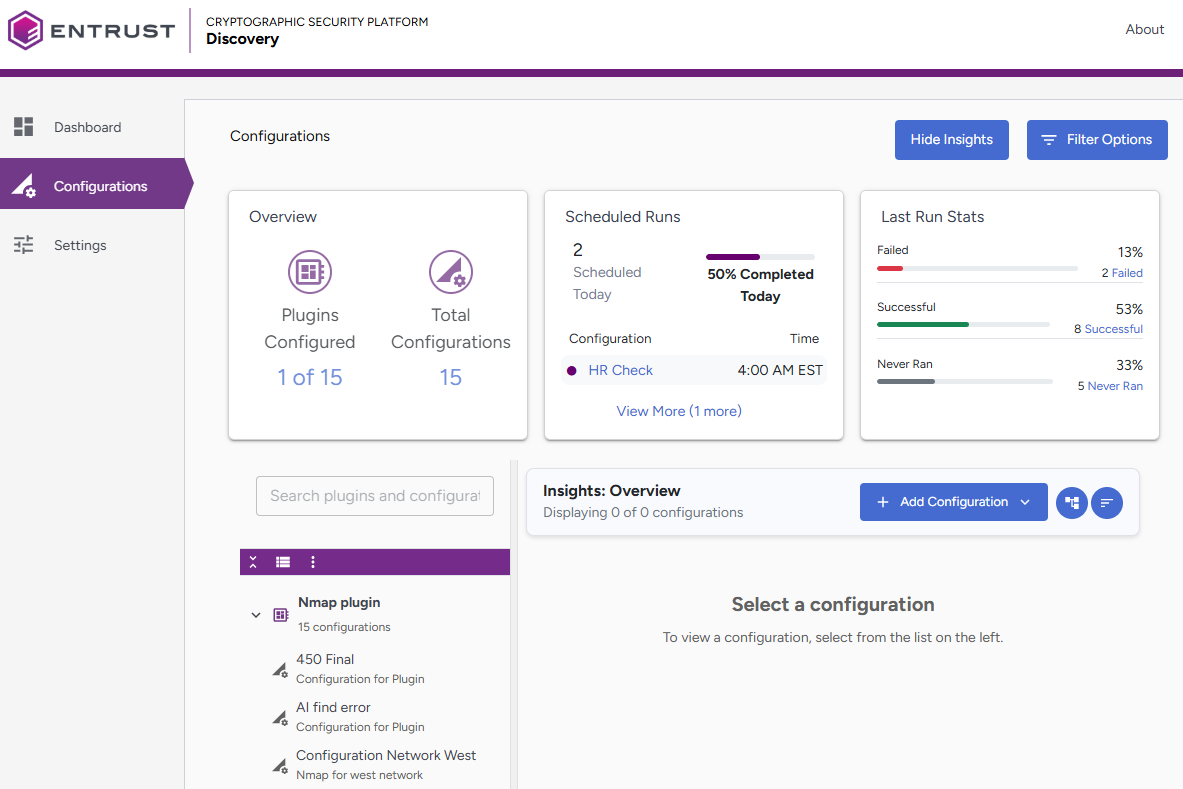
The following widgets are available.
Overview
The Overview widget displays two key metrics:
- Plugins Configured: Displays the number of available plugins that have at least one configuration. For example, 1 of 15.
- Total Configurations: Displays the total number of individual configurations set up. For example, 15.
When you select a plugin tree, the plugin tree will change accordingly.
Scheduled Runs
This widget displays today's upcoming scheduled runs. It displays the configuration names along with their scheduled run times.
Clicking a configuration name filters the plugin tree, allowing you to view more configuration information in the content panel.
Last Run Stats
This widget displays execution results from recent runs in the following categories:
- Failed: Configurations that encountered errors during execution.
- Successful: Configurations that completed without errors.
- Never Ran: Configurations that have not been executed yet.
Click any category to filter the plugin tree and display only those configurations.